Open in the graph →

PERSONAL SYSTEM // ENERGY · 2024

Powerpulse.

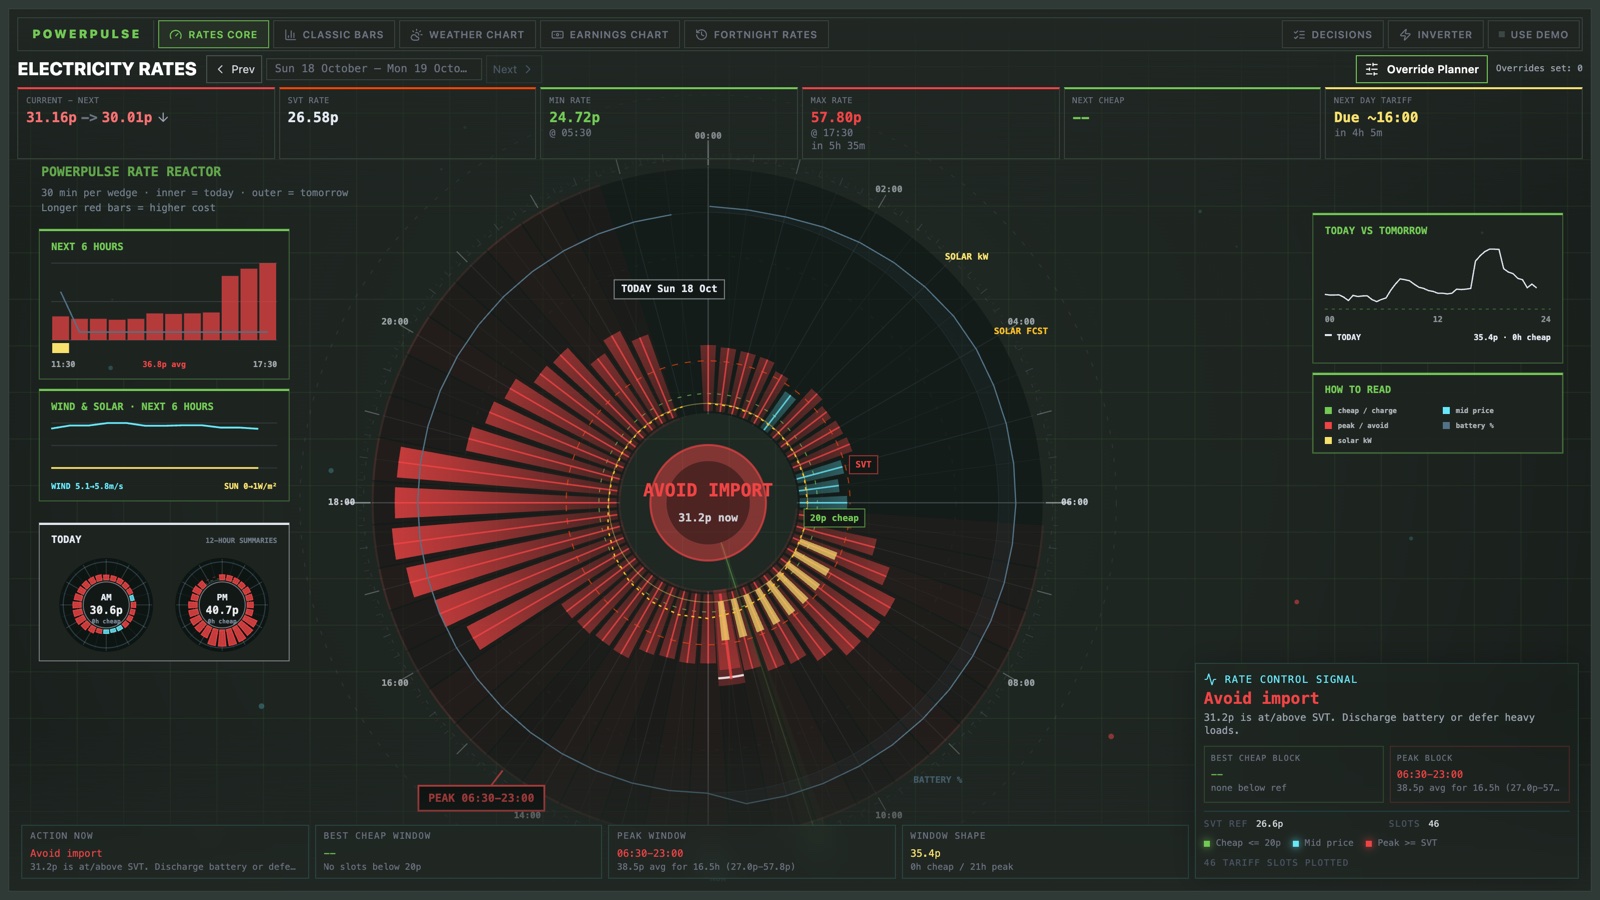
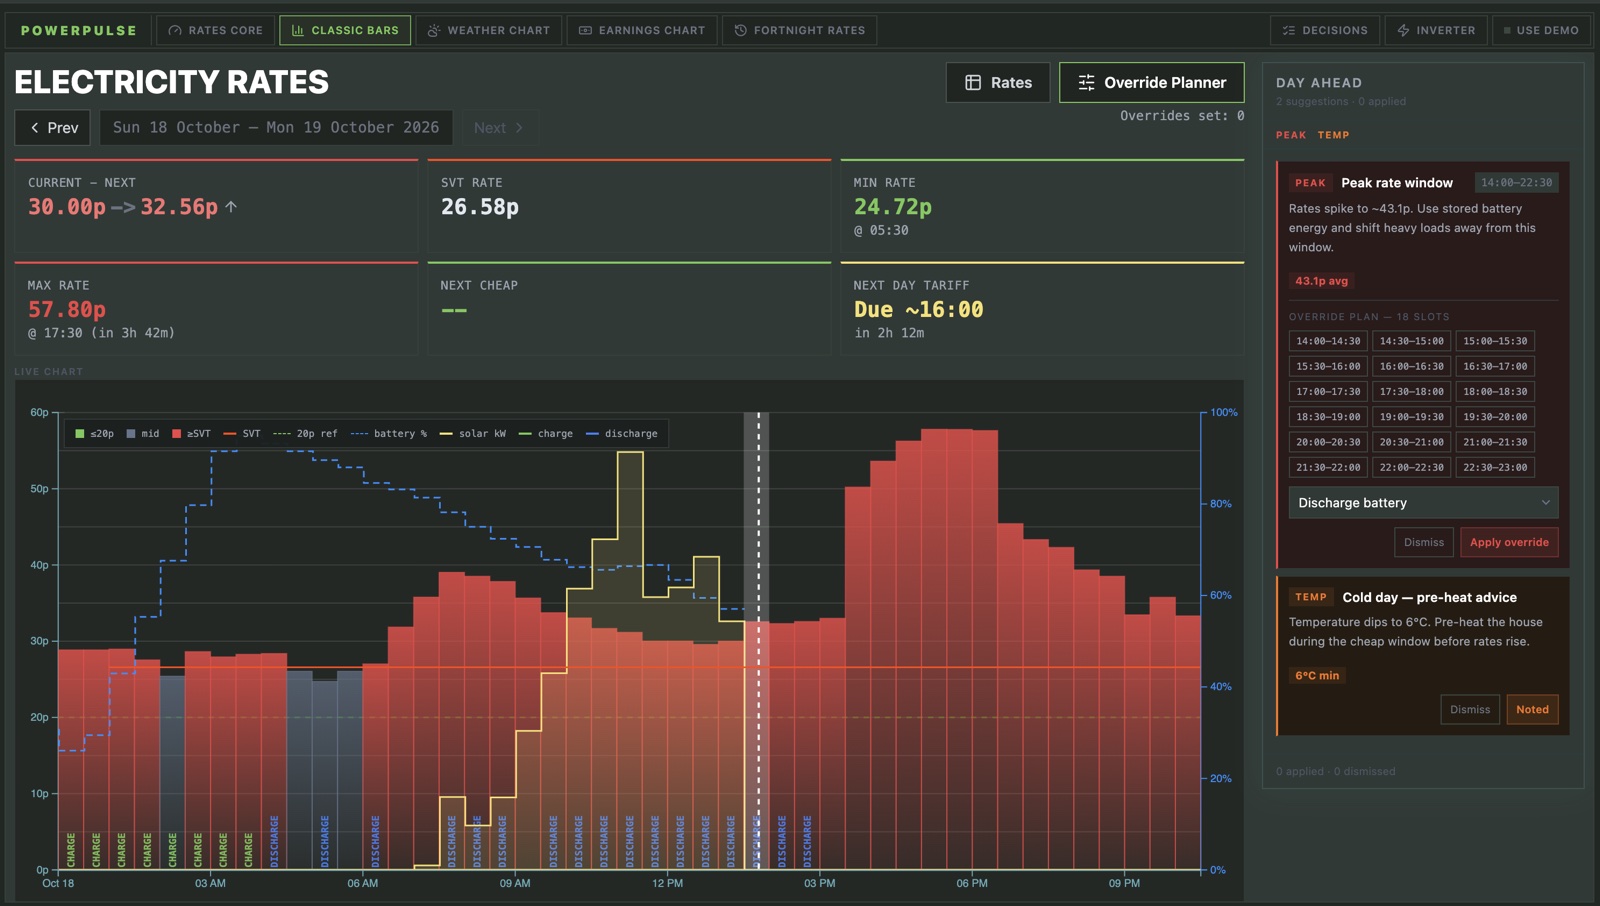
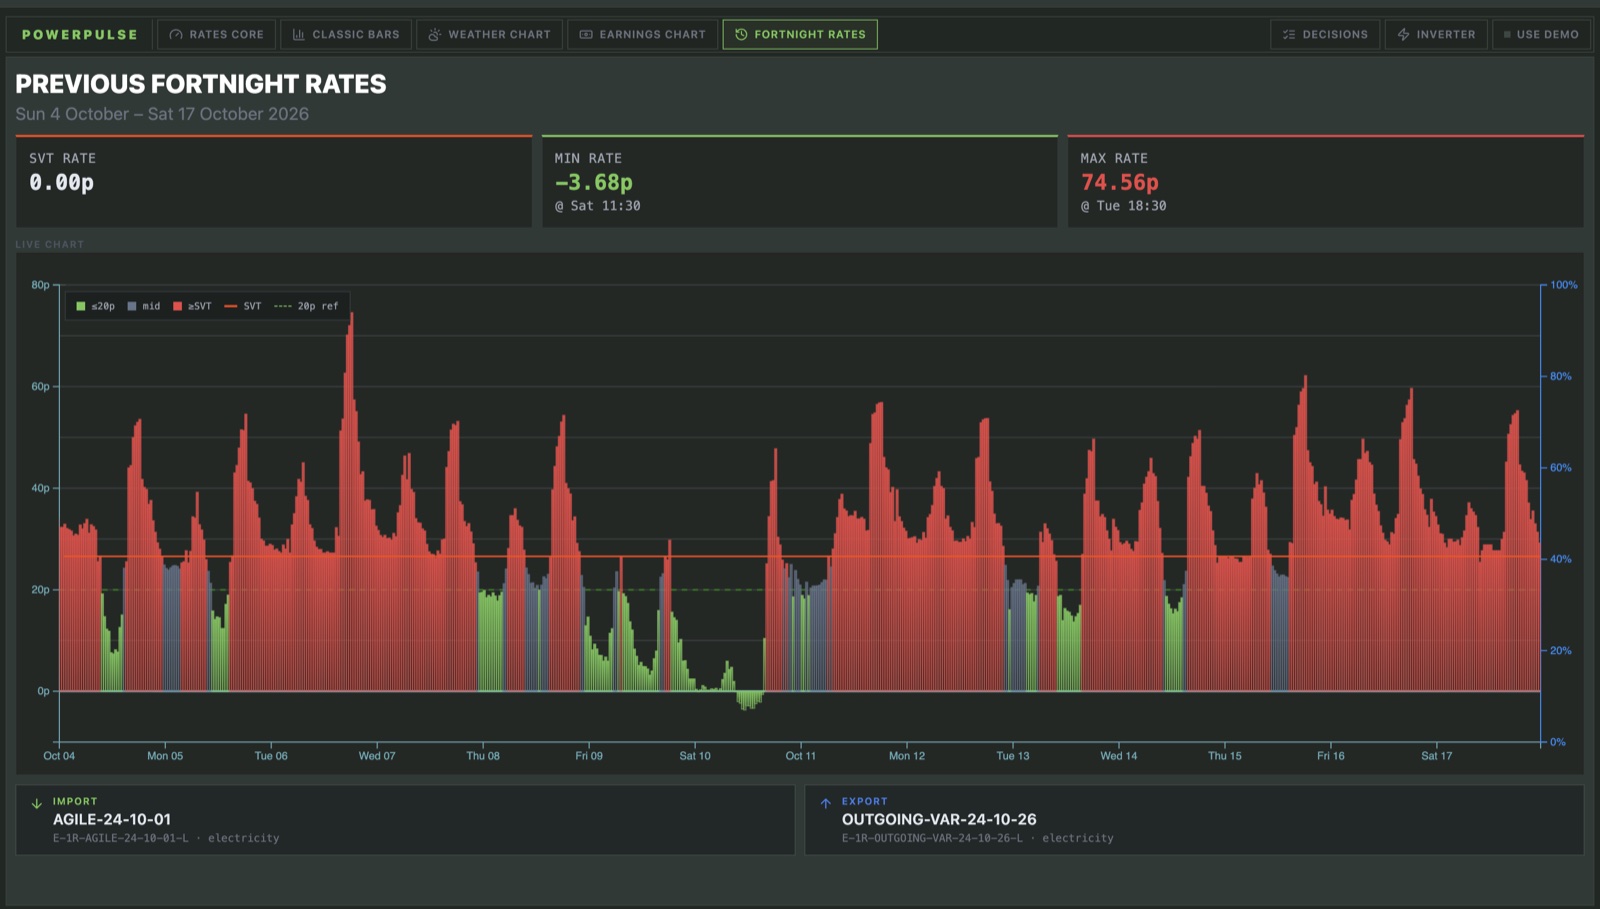
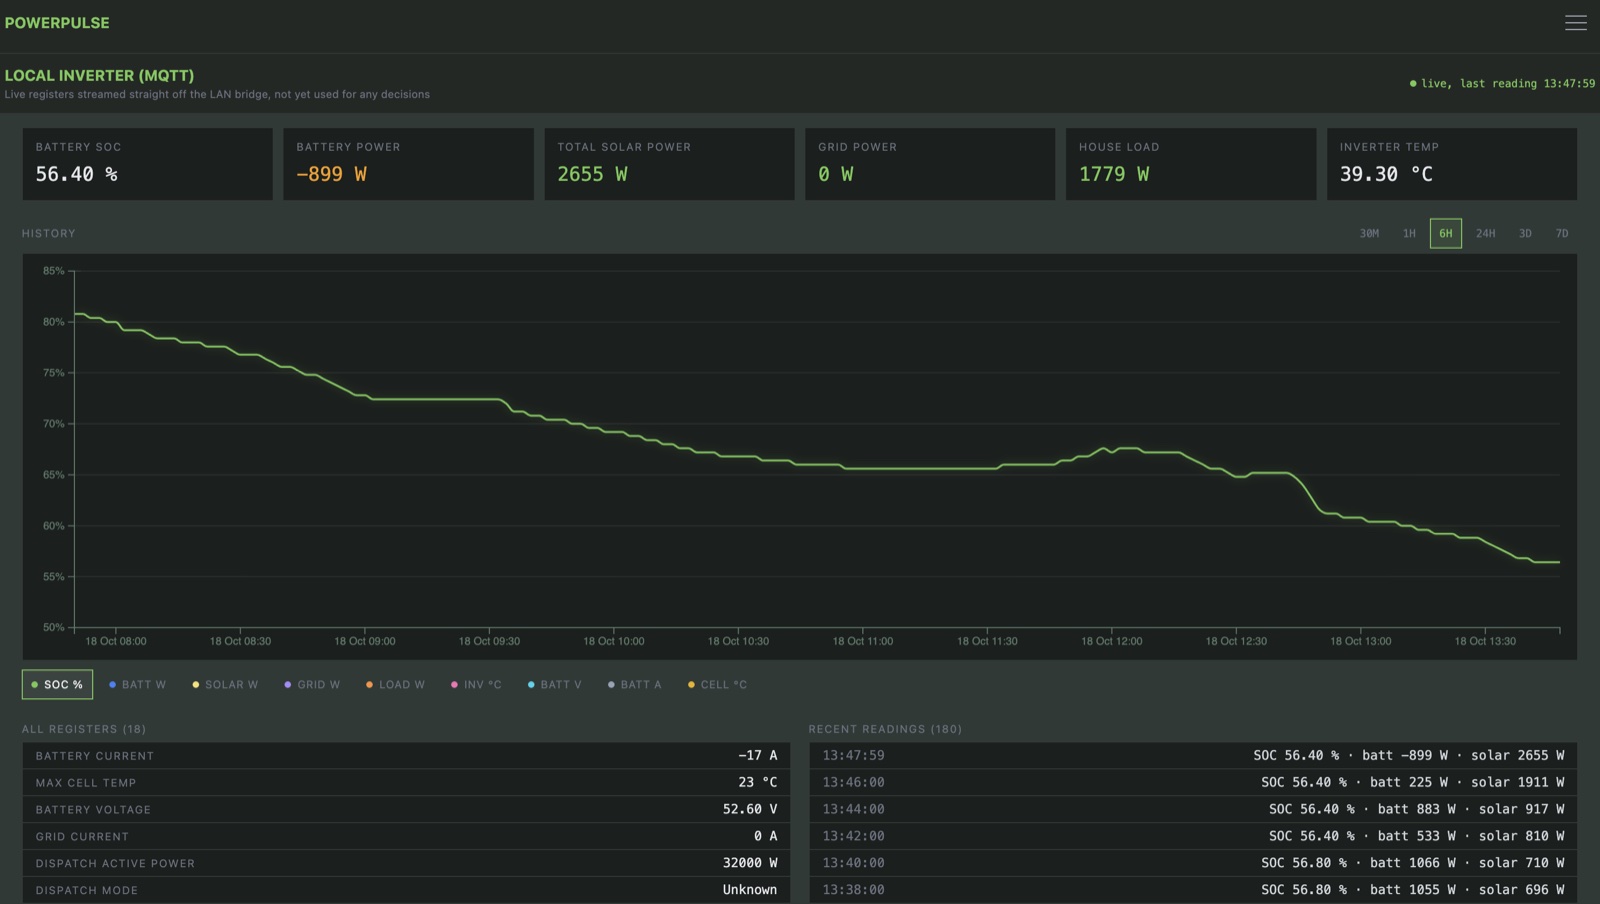
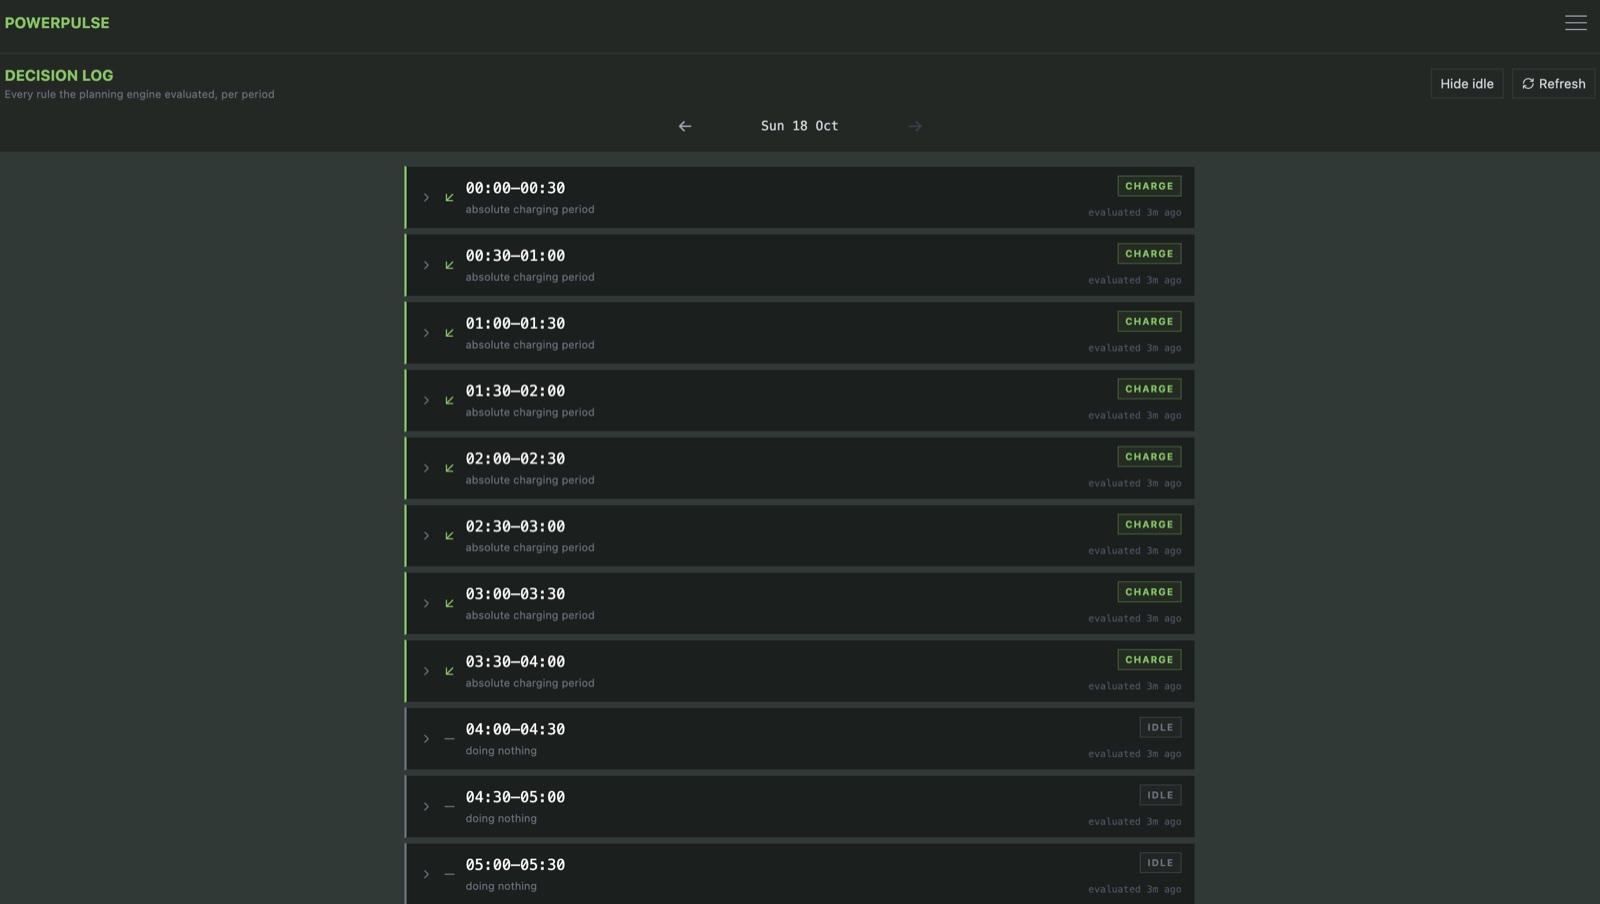
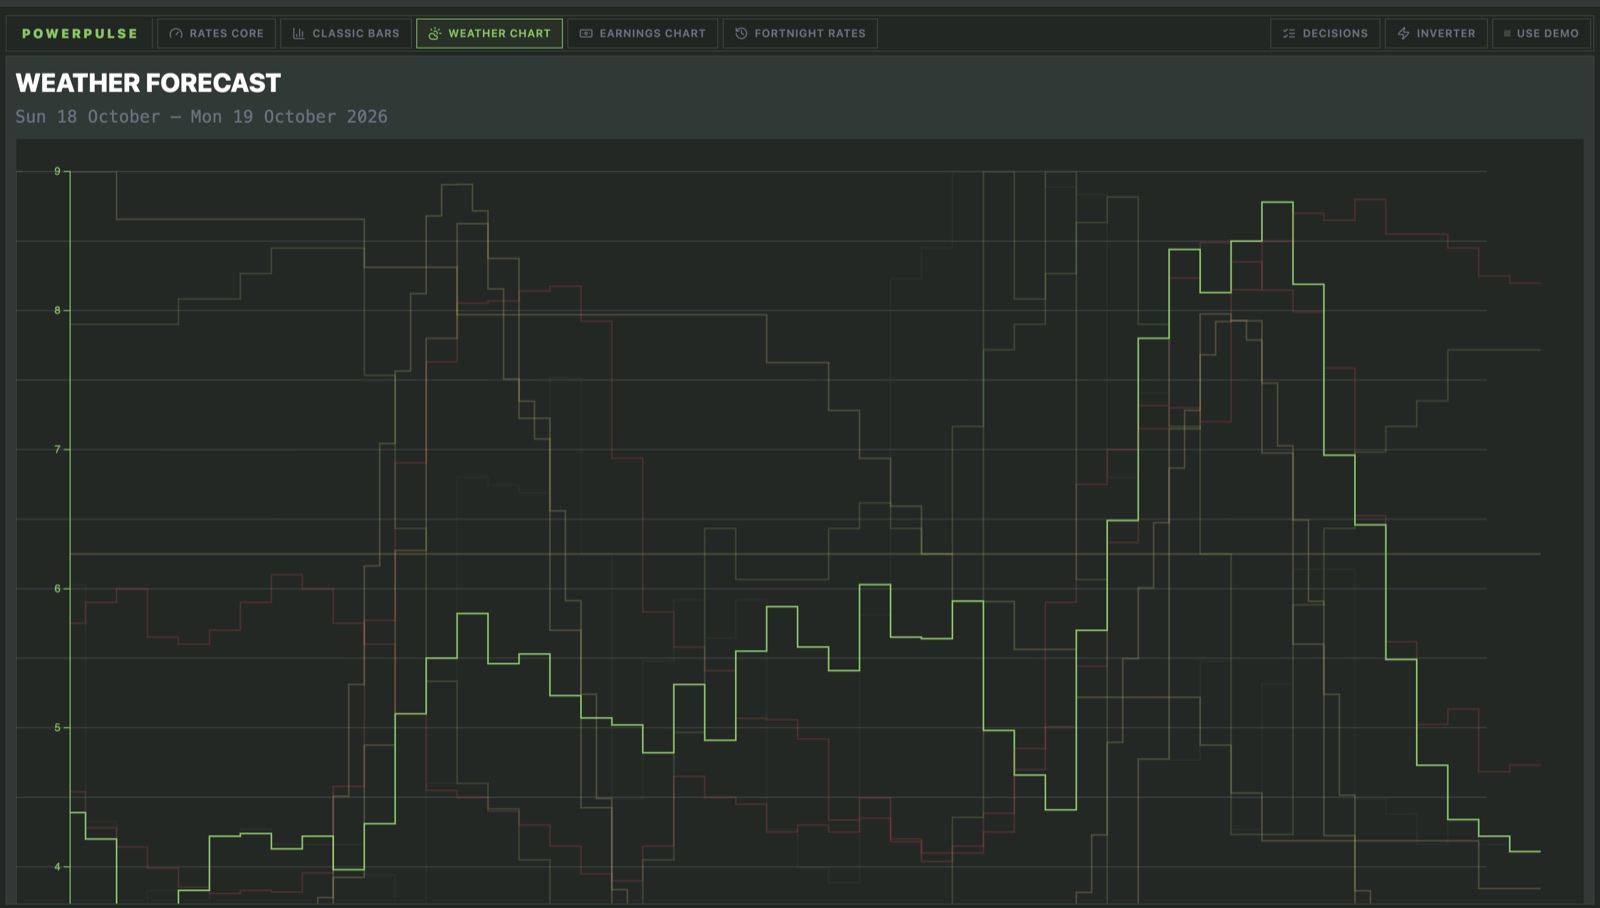
Powerpulse rate reactor: a radial chart of half-hourly electricity prices for today and tomorrow, with the cheap and peak windows marked Powerpulse classic bars: half-hourly rates coloured cheap, mid and peak, with battery level, solar output and the charge and discharge plan, beside day-ahead suggestions Powerpulse previous fortnight: every half-hourly rate over two weeks, including a dip below zero Powerpulse local inverter: live battery, solar, grid and house-load readings streamed over MQTT, with six hours of battery history Powerpulse decision log: the rule the planning engine chose for each half-hour period, charge or idle Powerpulse weather chart: the forecast lines the planner weighs against the rates

A home energy intelligence system for tracking power usage over time. It pulls live readings into API and cron services, stores telemetry in time-series/database layers, and presents the result as a Next.js dashboard with charts and trend views.

STACKNext.js · React · TypeScript · D3 · Express · PostgreSQL · InfluxDB
TYPETelemetry · Dashboards · Automation

Built with

  • Next.js
  • TypeScript
  • Tailwind CSS
  • D3
  • Node.js
  • MQTT

Runs on

  • PostgreSQL
  • InfluxDB
  • Docker

See it in the graph → All work Get in touch